
Your whole maple season, in one place
Track collections, boils, and yields across sugar bushes. Plan runs with weather and flow outlooks. Keep your whole crew in sync — from the sugar bush, not the spreadsheet.
Built for real maple operations
Whole season in one place
Dashboard, collections, boils, and analytics tied to your operation and season.
Know when sap is going to run
7-day forecast and sap flow predictions help you plan sap runs.
Built for the sugar bush
Install as a mobile app (PWA), use it offline, and sync when you have signal again.
Your crew, one operation
Invite your team with roles, get live updates, and share seasons and sugarbush data.
How SapMap works
Log data per season, per sugarbush, and track production.
01
Create an operation
Your syrup business — home bush, commercial operation, or both.
02
Start a season
Name your season. Collections and boils stay scoped to that season.
03
Add sugar bushes
Pin sugarbushes on a map for local weather, set tap counts, and track per bush.
04
Log collections & boils
Record daily sap, evaporator sessions, and syrup out — yields calculated automatically.
Everything you need for the season
A deep dive into what SapMap offers — from daily logging to flow predictions.
Dashboard — your season command center
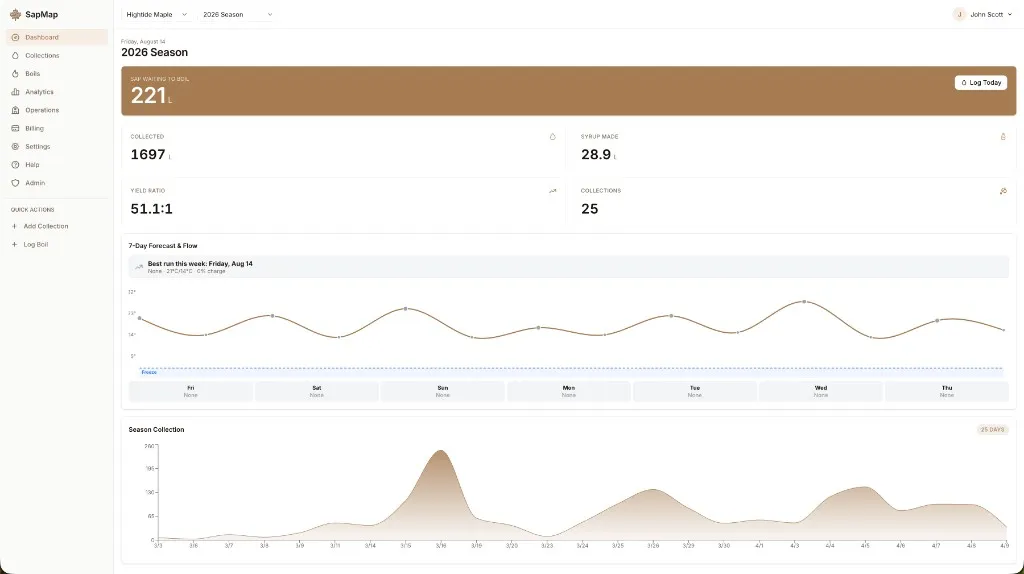
See sap collected, syrup made, and yield ratio at a glance. Know how much sap is waiting to boil, review your season chart, and jump straight to logging today's collection or starting a boil.
Sap waiting to boil with quick log action
7-day weather forecast with daily high and low temps
Season collection chart and key stats cards
Flow predictions — plan before you run
See daily sap flow predictions on your dashboard — from Not Ideal to Overflowing.
7-day flow tier outlook on the dashboard
Highs and lows.
Daily weather updates.
Collections — daily sap per sugar bush
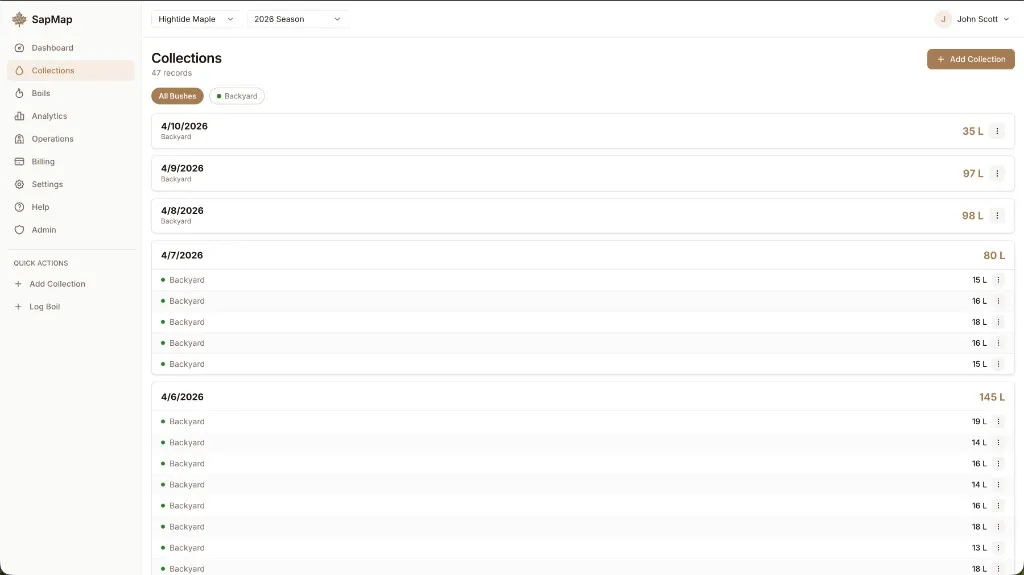
Log sap volume by date and sugarbush. Filter by bush, add optional Brix readings, and keep notes. Works offline in the bush — entries sync when you're back online.
Per-sugarbush logging with chip filters
Optional Brix (sugar content) readings
Works offline with automatic sync when signal is regained
Boils — evaporator sessions & yields
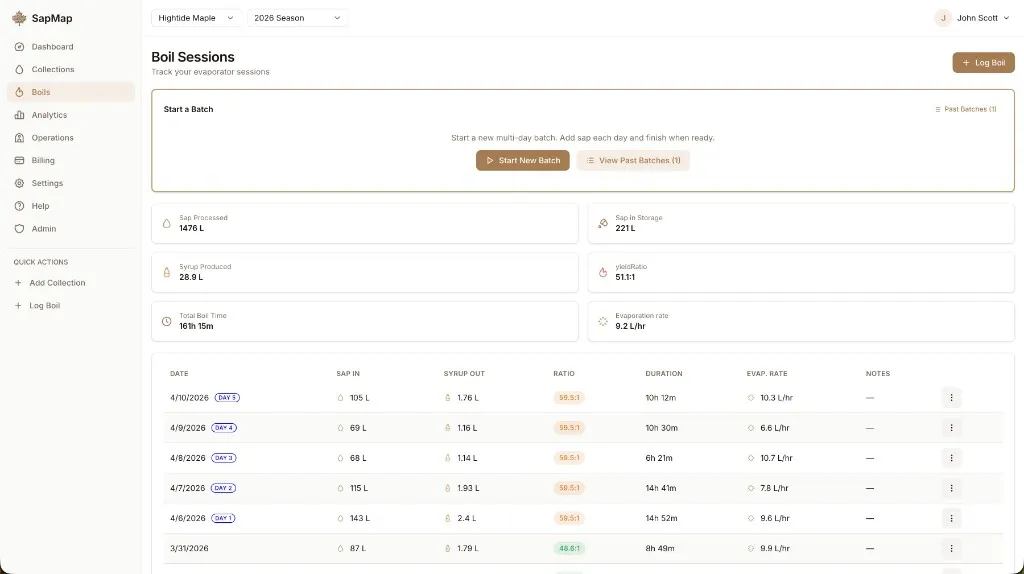
Record sap in and syrup out with live yield ratio calculation. Use today's boil quick-add buttons, or run multi-day batches when your evaporation spans several days.
Automatic yield ratio from sap and syrup volumes
Customizable quick-add amounts
Multi-day batch workflow for long boils
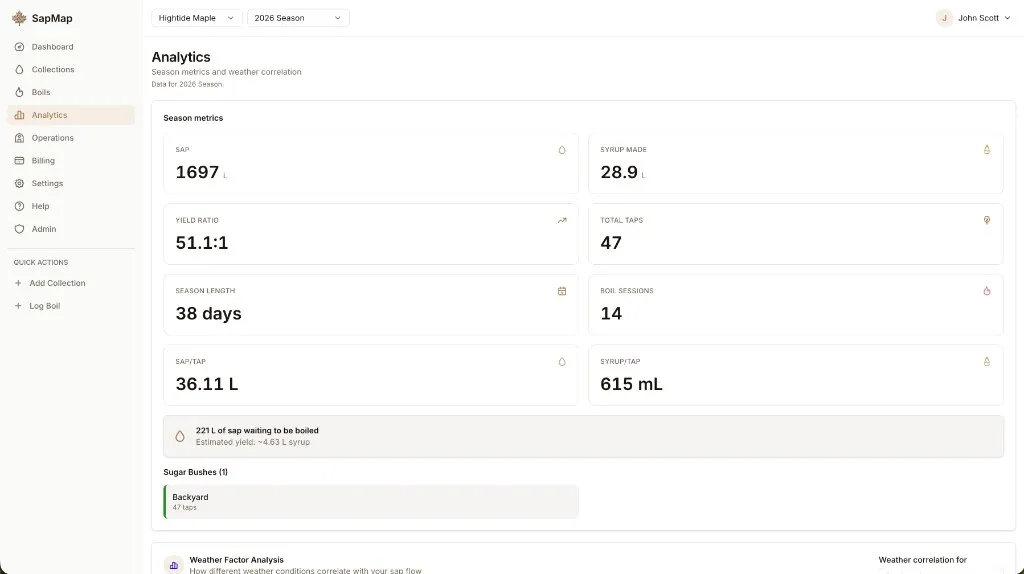
Analytics — weather science for your sugarbush
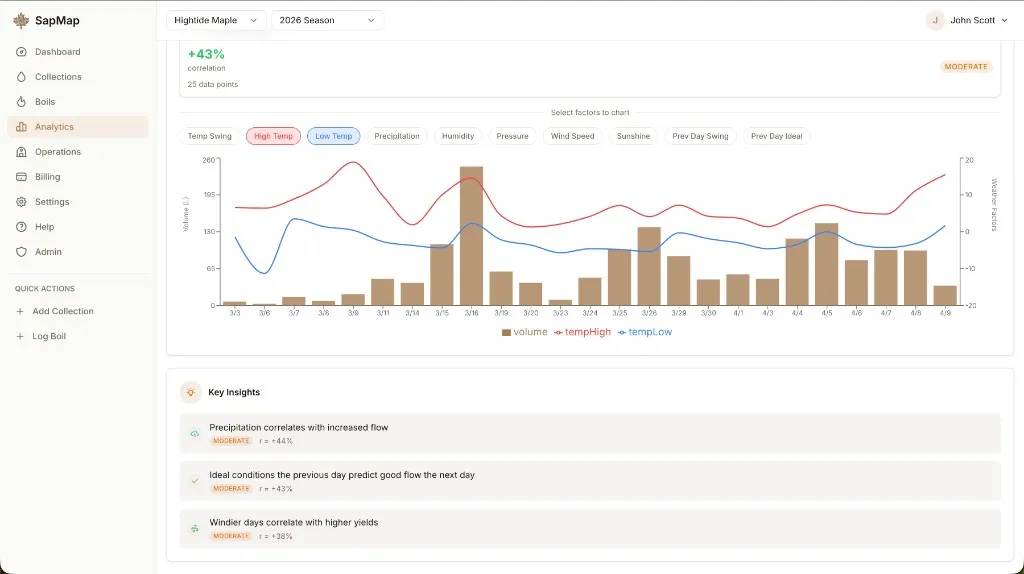
Go beyond the dashboard with weather factor analysis, interactive charts, and key insights about what drives your sap. Backtest prediction accuracy against your actual collection history.
Weather correlation cards — temp swing, precipitation, humidity, and more
Interactive sap volume vs weather factor charts
Prediction accuracy backtests with R² and MAE metrics
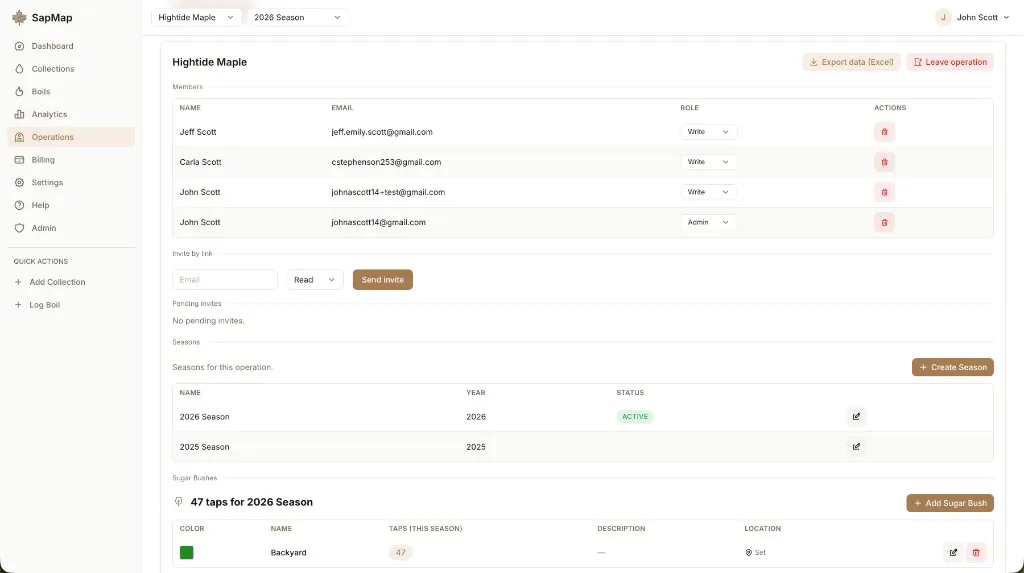
Operations & teams — run it together
Manage multiple operations from one account. Invite crew with Read, Write, or Admin roles. Pin sugar bush locations on a map, export all data to Excel, and keep everyone on the same page.
Email invites with role-based access
Map-based sugarbush locations for local weather
Export operation data to .xlsx
Built for the field — not just the desk
Install SapMap like a native app on your phone. Log collections and boils with no cell signal. Get push notifications when your crew logs activity. Changes sync live across the team.
Installable PWA on iOS and Android
Offline logging with sync queue
Realtime updates and push notifications
See SapMap in action
Your whole team can share an operation and track the season together.
Simple pricing
Start free with your first sugar bush. Add sugarbushes and pro features as your operation grows.
Prices in USD.
First sugar bush
Free
One sugarbush with logging, dashboard, collections, and boils.
Extra sugar bush
$6/yr
Additional sugarbushes for other sugarbush locations.
Analytics
$12/yr
Weather correlation, insights, and prediction accuracy backtests.
Flow Predictions
$12/yr
7-day sap flow predictions.
Frequently asked questions
Ready to track your season?
Start free with your first sugar bush. No spreadsheet required.
Open SapMap
